PowerGraph: A Mobile Energy Measurement Framework for Mobile Devices
Several approaches and tools to measure the power consumption of mobile devices (smartphones, tablets) exist. They range from
research solutions such as BattOr to professional lab equipment, such as the
Monsoon Power Monitor.
However, none of those are able to combine the requirements we define as essential for a reliable power consumption measurement solution.
We argue that an approach should be mobile in order to get results from real-world scenarios, limiting the applicability of approaches such as the Monsoon Power Monitor. On the other hand, a certain precision should be offered by the measurement solution which is mainly limited by the
used hardware, as in BattOr.
Therefore, our design goals for an own solution were as follows:
- High precision and sampling rate
- Mobile without relying on the measuring object's battery
- Reproducable and affordable
Approach
PowerGraph is an extension board that can be mounted on a Raspberry Pi (B+). The major task of PowerGraph itself is sampling the current drain of the connected mobile device while simultaneously providing the operational voltage for the mobile device. Figure 1 depicts our prototypical implementation of PowerGraph.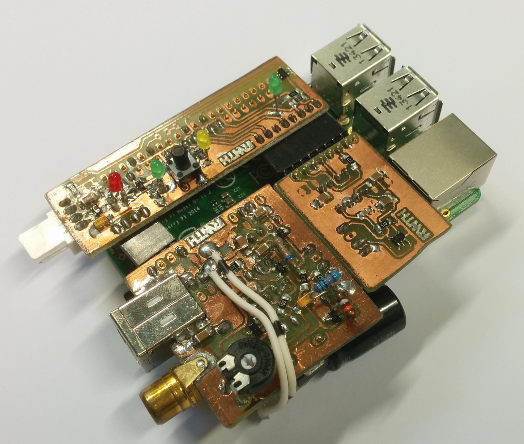
More information about the hardware design is available here.
The hardware design is licensed under Creative Commons - ShareAlike 3.0 License. More information about the license can be here. A full text version of the license is available here.
Software
As PowerGraph creates measurement results with a high rate, we had to implement a driver for the SPI interface for the Pi to keep up. The standard driver does not allow uninterrupted streaming of results, which is a downside as the ADC has no internal buffer. Available drivers use a FIFO queue which is controlled by the CPU. If the CPU fails to empty the FIFO on time, the FIFO buffers will run out and both, the SPI transfer and ADC sampling will stop. To overcome this drawback, our driver uses the DMA controller.More information about the driver, source code and the GUI can be found here.
Exemplary Output
Figure 2 depicts an exemplary measurement run obtained with PowerGraph. The shown plot represents the current drain for a booting Nexus 5. To this end, we separated the battery connector from a LG BL-T9 battery pack. Subsequently, we connect this battery adapter to PowerGraph and to the phone.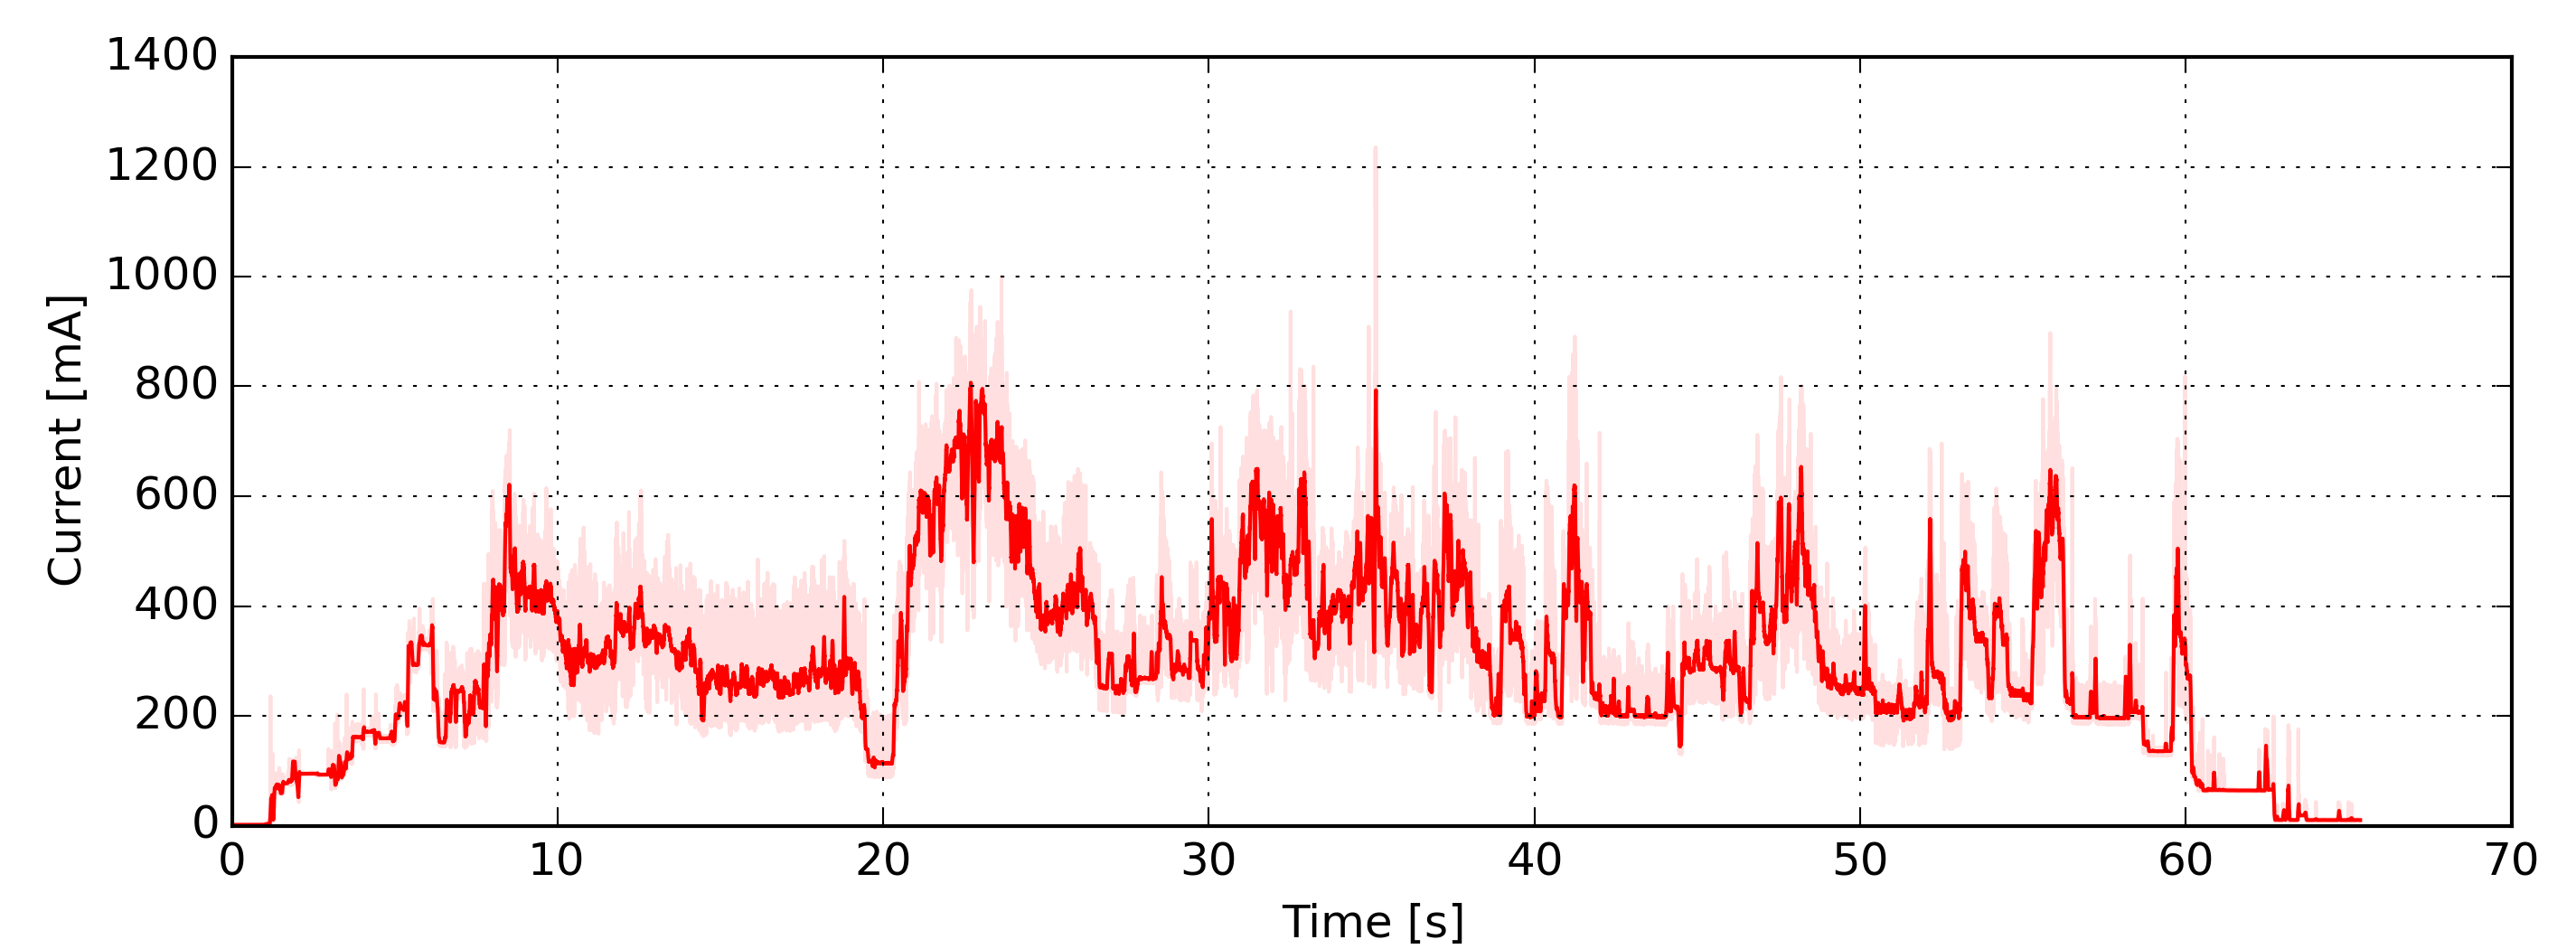
The depicted plot can be reproduced using the record file and the visualization script, which can be downloaded here.
Tested with OSX 10.10.4, Python 2.7 and pylab/matplotlib 1.4.3.
Contact
Researchers
Torsten Zimmermann, M.Sc.Chair of Communication and Distributed Systems
RWTH Aachen University, Germany
web: https://www.comsys.rwth-aachen.de/team/torsten-zimmermann/
mail: zimmermann (at) comsys.rwth-aachen.de
Jan Rüth, M.Sc.
Chair of Communication and Distributed Systems
RWTH Aachen University, Germany
web: https://www.comsys.rwth-aachen.de/team/jan-rueth/
mail: rueth (at) comsys.rwth-aachen.de
Student Assistant
Roman Bartaschewitch, B.Sc.Chair of Communication and Distributed Systems
RWTH Aachen University, Germany
mail: roman.bartaschewitsch (at) rwth-aachen.de